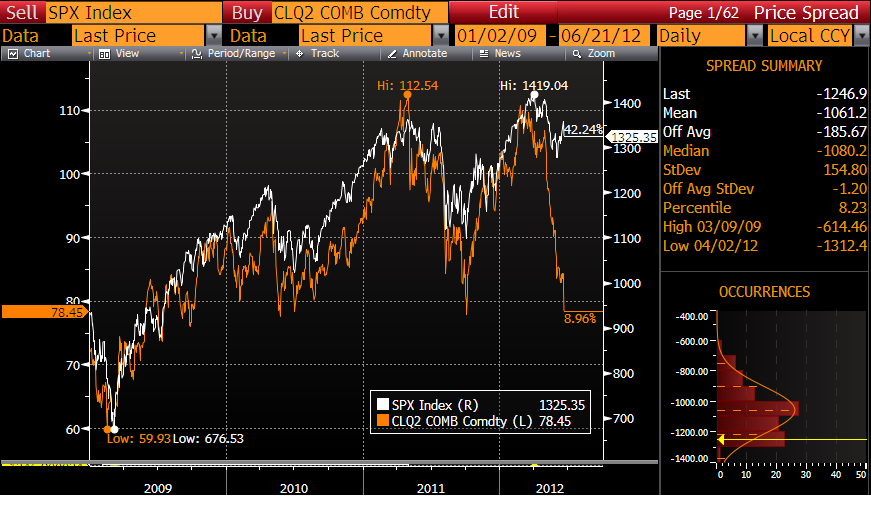
Both markets were moving together until the past six weeks when oil began its sharp sell off. Considering the US remains heavily dependant on oil as a source of energy, among other things, it is often considered a sign of aggregate demand and thereby economic growth. Some analysts are trying to explain the divergence as a short-term oversupply issue in the oil markets, yet futures contracts across the board have been dropping rapidly. Similar price declines experienced by broad commodity indexes offers further support to global growth concerns.
US equity markets are increasingly becoming the odd-man out in global asset markets. The recent resilience can either be seen as a sign of strength or as a sign of complacency. If the latter option proves correct, markets may be setting up for a massive sell-off.
Related posts:
Extension of Operation Twist Suggests No QE Until After Election
One More Rally Before the Crash
No comments:
Post a Comment